Ideas…

Infographic

My infographic will simply inform the viewer on what the theory of relativity is, in the most simplest way (due to my own knowledge of it being limited). When this infographic is incorporated onto one of the other outputs I could make it interactive (or at least state that it will be) just by adding hyperlinks or animated elements and so on. Which leads me to…

Mobile Design

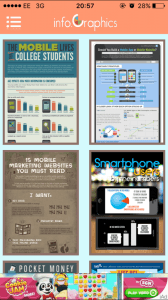
I had the idea of an app that holds thousands of infographics of all different kinds of subjects. Therefore I could create a homepage for it, categories menu, and a page for my own infographic. I went onto the app store on my phone to see if such an app already exists and it does but here’s what it looks like:

IMG_0266IMG_0267


I want to create a design for an app much better than this one.

A2 Poster and Web Design

I’m still not 100% sure what to do with these outputs yet, so I am going to focus on the infographic and mobile design and hope that my ideas stem from those.

Web & Mobile Design

This project is all about displaying information across different layouts, an online desktop design or televisual screen display, a smartphone/mobile device display and an A2 poster. I will need to take into consideration the different size of each of these outputs in order to create an effective design.

responsive-web-design-infographic-whipplehill-2014Web Design

Why Web Design Is Losing It’s Soul‘ – this article looks at what it says on the tin. From this I hope to get ideas on what to do/not to do in my design. ‘

As responsive design becomes the norm, designers have developed a reliance on boxes and grids, argues Noah Stokes.

The article basically says that due to responsive web design (RWD), the web is “losing it’s magic”. Noah Stokes argues that everything is just boxes and grids, leaving no room for creativity. This stands out to me as I want to something a little different than just following a grid layout. Hopefully, by doing this, my designs will stand out a bit more than every other website out there.

Mobile Design

‘What makes a good mobile site? Google partnered with AnswerLab to research how a range of users interacted with a diverse group of mobile sites. From this research, Google established 25 principles of mobile site design to help companies build mobile sites that delight customers and drive conversions.’ – Google, Multi-Screen Resources

The results were grouped into five sections of mobile design: home & navigation, site search, commerce & conversions, form entry and usability and form factor. I will be looking through the results of each section and picking out the information that I think relates to what I am doing and will be helpful to me.

Home & Navigation

  • Always put your key calls-to-action where you know users will see them, as it is easy to miss menu items
  • A shorter menu with distinct categories is easier to navigate
  • Use your logo as a button to return to the home page

Site Search

  • Place your site search at the top of your homepage

Usability and Form Factor

  • Don’t make users pinch to zoom; make sure everything can be seen clearly as it is (they found users got frustrated when they had to zoom).

I also found an article on ‘5 Big Mobile Design Trends of 2015‘ which highlights that ‘subtle colour palettes, animated elements, more scrolling, storytelling and blurred backgrounds’ are what’s going on in the world of mobile design right now. To make my design effective to the average person in 2015 I could incorporate some of these elements.

What is the theory of relativity??

In this post I will be doing some research into the theory of relativity to try and jot down all the information I will be using in my designs. This can include general information, quotes, statistics, images and so on. I will also make sure I’m showing which sources I am using throughout.

General Info

– The theory of relativity includes two theories by Albert Einstein – special relativity and general relativity.

– The general concepts of this theory:

  •  Measurements of various quantities are relative to the velocities of observers. In particular, space contracts and time dilates.
  • Spacetime: space and time should be considered together and in relation to each other.
  • Space is a physical entity that can be changed, space is not just nothing, space can affect mass (gravity)
  • The speed of light is nonetheless invariant, the same for all observers.

(wikipedia)

– 1905, special relativity. 1915, general relativity.

Quotes 

“By 1905, Albert Einstein had created a new framework for the laws of physics – his special theory of relativity. However, one facet of physics appeared to be incompatible with his new ideas: the gravitational force as described by Newton’s law of gravity. Special relativity provides a new framework for physics only when gravity is excluded. Years later, Einstein managed to unify gravity and his relativistic ideas of space and time. The result was another revolutionary new theory, general relativity.” – einstein online

Examples and Equations

– E = mc 2

– A clock ticks slower when travelling at a high speed than when it does when stationary.

Images

I am thinking of taking existing images and turning them into a cartoon style either by hand, on a graphics tablet or on photoshop by using shapes and brushes. I have already found some existing cartoon planets that I like so I will be trying to make my own versions of those. I also want some imagery that isn’t cartoon so it’s not overloaded by it. Some ideas of what imagery I’ll want:

  • Black hole, space, planets, rockets,  international space station, etc
  • Albert Einstein portrait
  • Blackboard and chalk (to display information as if it was written on one)
  • Clocks to show time
  • A diagram to show gravity

Infographics

I have been doing some research into infographics so I could get some inspiration and ideas flowing. I’ve been looking at examples on www.customermagnetism.com/infographics/ which has a variety of different infographics to show.

what-is-an-infographicI liked this one as it proved to me how effective infographics are by explaining very clearly what they are. I  like the design and how it continues down the page – it shows that infographics can be very flexible in this  way and don’t need to be a set size. The information displayed is minimal and yet useful – which shows me that I don’t need to go completely in depth with it. I can include quotes, statistics (displayed as graphs, charts, through imagery, etc), colour and images. I do like the style of this infographics, which has been presented in a grid fashion, but I think I would like mine to be less precise in this way. I will try grids but I would rather not use this layout. I have a colour scheme in mind, which I can see from this infographic is important to keep a balance and make the vast amount of information easier to read and comprehend.

I also had a look on this website – www.informationisbeautiful.net which gave me a good insight into different ways of displaying information so that it is visually pleasing but also how to make it interactive. For example: ‘Non-Fiction Books Everyone Should Read’ – this infographic names different book titles in a creative design and when you click on each title it leads you to a website where you can buy it. I won’t be able to do this myself, but I can always explain what the infographic would be like when online.

Existing ‘Theory of Relativity’ Infographics

I had a look at what infographics for the theory of relativity are already out there to see how I could make mine different but also to get some inspiration and knowledge. After googling ‘theory of relativity infographics’ I was soon able to pick out which I liked and disliked –

relativity-how-it-works-150304e-02I really liked this infographic (<— click), which helped to explain the theory to me. It’s got a lot going on visually but in a good way that keeps you interested. I feel like the length of the infographic helps to spread out the information. As you cannot see it all at once it breaks it up a lot more and makes it simpler for the audience. The layout is split into sections which I like, but I also want to have a go and mixing the layout around and overlapping sections to see how this would look too.

theory-relativity

I both like and dislike this infographic. I do like how you can see all of the infographic on your screen without scrolling down or across because it helps to show off the overall design involved such as the colour scheme. However, the colour scheme is one of the things I don’t like. It’s too dull in my opinion and the typeface used is very boring. I think this infographic was probably made for an older target audience and perhaps someone who is very interested in the subject, perhaps a physics student. It’s not the kind of style I would use in my own.

media_relativity

I can definitely say I don’t like this one as its just too plain and boring. The typeface is plain, simple, boring and dull. There is not a lot going on visually with very basic images. The colours do not allow anything to stand out. It makes the information as boring as the way it is presented which is not what an infographic should do.

Looking at these infographics has given me a good idea of what I want to do and what I definitely do not want to do. Now I need to research more into the theory itself so I know what information to present.
Project Two: Multi Format Data Visualisation

As project two is all about presenting Einstein’s theory of relativity on different platforms, I thought I should begin by looking up on what it actually is…

Albert Einstein, in his theory of special relativity, determined that the laws of physics are the same for all non-accelerating observers, and he showed that the speed of light within a vacuum is the same no matter the speed at which an observer travels.

Space.com

In Einstein’s general theory of relativity, space and time become even more flexible. “Your mileage may vary,” and so may the time intervals you measure, depending on where and when you are.

einstein-online.info

E = mc 2


Audience:

In terms of the audience for the specific content I want to create, the visuals I have in mind would suit a younger audience, perhaps primary school around year three and four. Therefore I’ve looked at websites for kids that explain the theory of relativity to see how they present it.

http://www.ducksters.com/science/physics/theory_of_relativity.php

http://www.kids.esdb.bg/einstein.html

The ones I’ve found are pretty awful. They’re dull, plain and simple (very web 1.0). Although they’re trying to be interesting and appealing to kids with the use of colour, they’re just not. If I was a kid looking at this in order to learn about the theory of relativity, I would be very bored and un-interested.

I also feel like my ideas could also appeal to teenagers for a GCSE or maybe undergraduate students. I’m thinking of having cartoon style images so the depth of information will determine whether it suits a primary school children audience or 15-19 year olds.