Now I have started putting my infographic together I have been referring back to my previous research on The Theory of Relativity where I made a post on what I could include in the infographic. However, I am now feeling that I need more research as I have made an infographic that is 15cm by 45cm and I need enough to fill this. I also plan on having a small section that has some ‘did you know’ facts about Einstein before going into the theory as I am creating a ‘100 years of the theory of relativity’ infographic and feel like it is needed. Therefore I’ll be researching into him as a person and scientist, too.
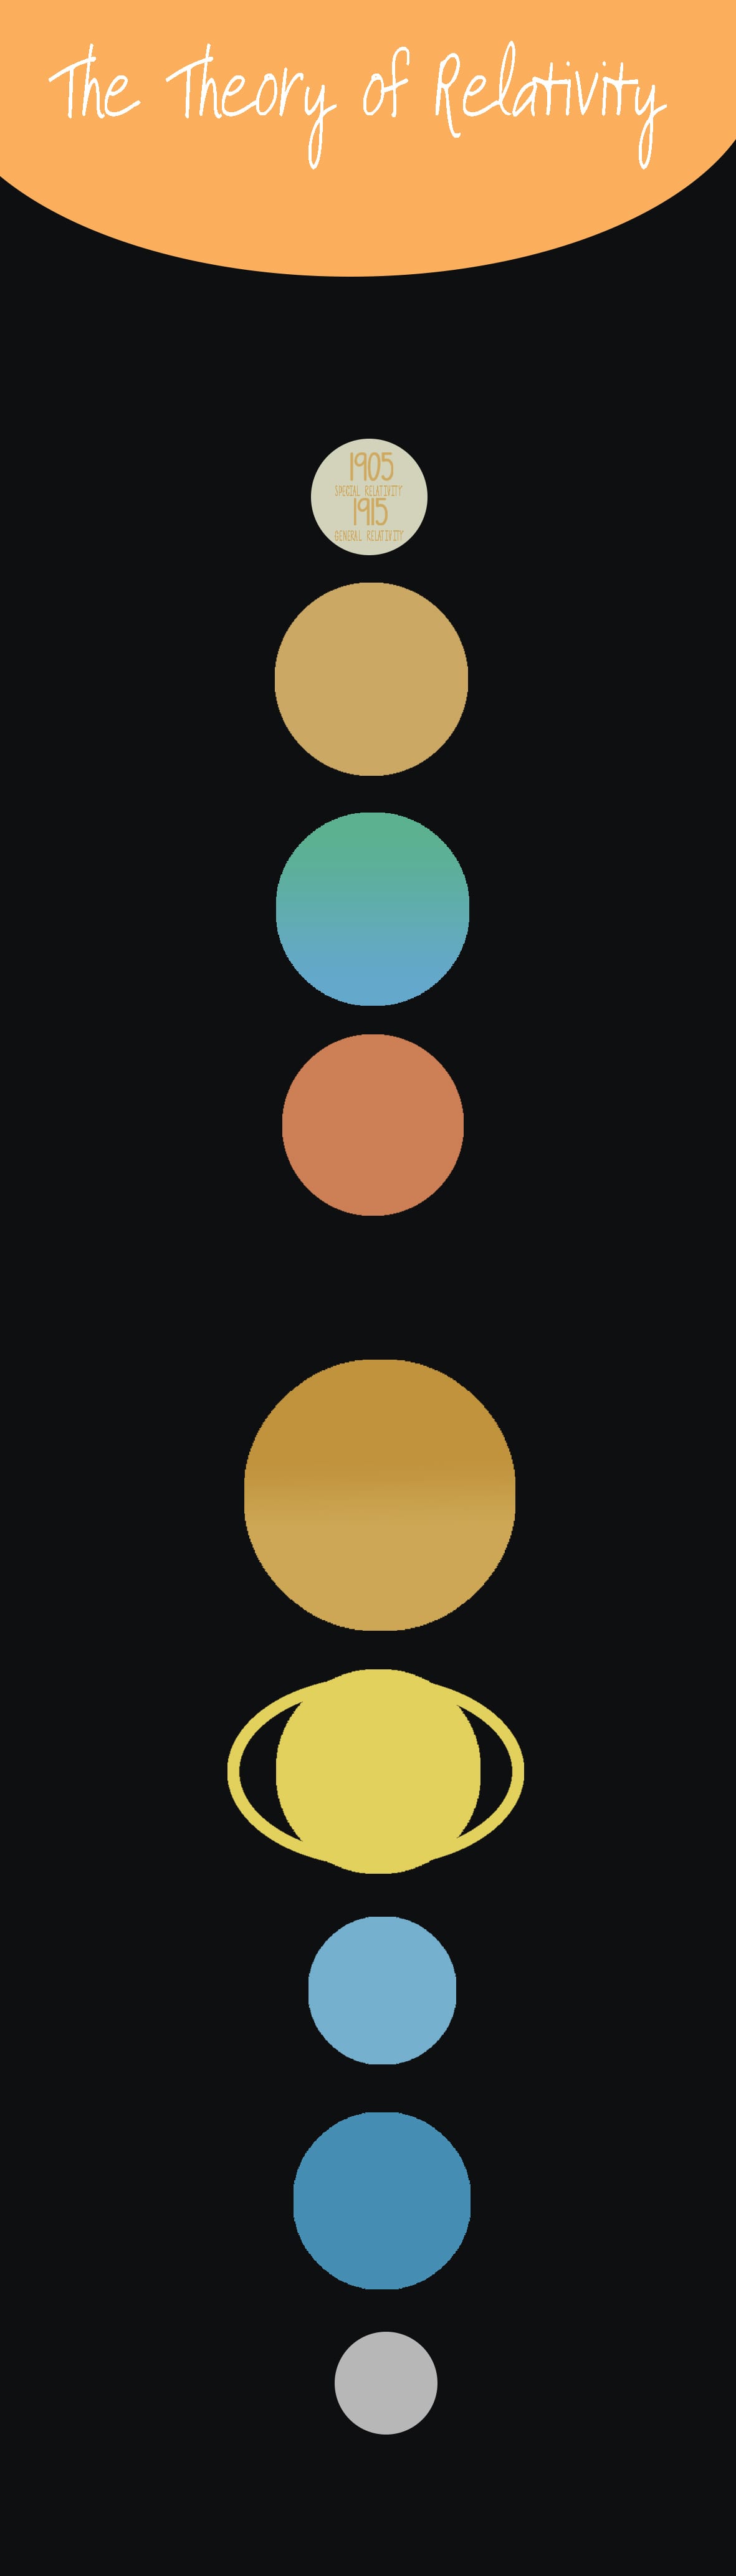
One of the first points I wanted to talk about in the infographic was the difference between special and general relativity.
In 1905, Albert Einstein determined that the laws of physics are the same for all non-accelerating observers, and that the speed of light in a vacuum was independent of the motion of all observers. This was the theory of special relativity. It introduced a new framework for all of physics and proposed new concepts of space and time.
Einstein then spent 10 years trying to include acceleration in the theory and published his theory of general relativity in 1915. In it, he determined that massive objects cause a distortion in space-time, which is felt as gravity.
– space.com
Special Relativity: the laws of physics are the same for all non-accelerating observers. The speed of light in a vacuum is independent of the motion of all observers.
General Relativity: this theory brings in acceleration. It determines that massive objects cause a distortion in space-time, which is felt as gravity.
I then opened as many web pages on ‘the theory of relativity’ that I could find, picking out all the information I wanted to use in my infographic.
‘8 ways you can see Einstein’s theory of relativity in real life‘
The implications of Einstein’s most famous theory are profound. If the speed of light is always the same, it means that an astronaut going very fast relative to the Earth will measure the seconds ticking by slower than an Earthbound observer will — time essentially slows down for the astronaut, a phenomenon called time dilation.
There’s also some other examples in this article that I can use but as my infographic design features planets and space I thought the astronaut one would work the best.
General relativity predicts that even light is deflected by gravity – a prediction that has been confirmed by numerous astronomical observations. In addition, it predicts exotic phenomena like gravitational waves and black holes.
– Einstein Online
Facts about Einstein: I found an article called ‘20 facts about Albert Einstein‘ and I picked a few that I could use.
- He failed his university entrance exam and had to re-apply a year later.
- Einstein never received a nobel prize for relativity. It was actually for the photoelectric effect.
- He did not like to wear socks.
- He married his first cousin
- He was offered the position of President of Israel, but he declined
As well as random facts I wanted to include a brief introduction of who he was, which I got from Wikipedia:
Albert Einstein (14 March 1879 – 18 April 1955) was a German-born theoretical physicist.
He received the 1921 Nobel Prize in Physics for his “services to theoretical physics”.
 I have overall simplified the home page for the mobile design. I removed the ‘search’ title as I thought the rectangle and magnifier icon made it clear that you can use this tool to search. The ‘most popular’ section has been simplified by only featuring one infographic at a time. There are arrows to show you can flick through the most popular infographics and a symbol below to show you can click to see more. The infographic has been halved to make the information clearer and if a user wanted to see the whole thing they would click the infographic and be taken to the page featuring it.
 I have also removed a few items from this page including the ‘scroll down’ text and ‘submitted by…’ text.

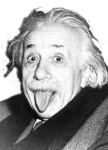 I found an image of Einstein
 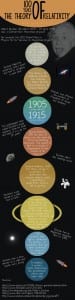 needed to be filled so I decided to add some imagery. For these I mainly found an image on Google and then traced over it on Photoshop. For the asteroid and galaxy images I went to a royalty free website (